Netdata Raspberry Pi Monitoring: You Can't Fix What You Can't See
I spent months running my self-hosted blog completely blind. No dashboards, no alerts, no idea what my Pi was doing at 2am. Here is how I fixed that with Netdata, Nginx, and Cloudflare Access in about 20 minutes.

A friend texted me on a Tuesday afternoon. "Your blog is timing out."
I opened a terminal. SSH'd into the Pi. Ran top. The CPU was at 98% and had apparently been there for a while. Ghost was still alive but barely. MySQL was thrashing. I had no idea what triggered it, how long it had been running that hot, or whether this had happened before.
I guessed at a few things, restarted some containers, and the situation resolved itself. But I couldn't tell you why it happened or whether I actually fixed it.
That is the problem with running a server blind. You only find out something went wrong when something else breaks. And by the time you notice, the interesting data is already gone.
I set up Netdata that weekend. This post walks through exactly how I did it: Netdata running in Docker alongside Ghost and MySQL, exposed through the same Nginx reverse proxy that serves this blog, and protected with Cloudflare Access so only I can open the dashboard.
What Is Netdata for Raspberry Pi Monitoring?
Netdata is a real-time performance monitoring agent that runs locally on your server. It collects metrics every second from the kernel, hardware, Docker containers, and running processes, then serves a live interactive dashboard on port 19999.
Nothing leaves your machine. No account required to get the basics working. No cloud dependency. It is self-contained in a single Docker image and has sensible defaults out of the box.
What it monitors automatically, with zero configuration:
- CPU usage (per core, system vs user vs iowait)
- RAM and swap
- Disk I/O and throughput
- Network traffic per interface
- Docker container stats (CPU, RAM, network per container)
- CPU temperature (useful on a Pi where thermal throttling is a real risk)
- Active processes and open file descriptors
The dashboard refreshes every second and the charts are genuinely good. It is not a minimal text table. It is the kind of thing you will actually keep open in a browser tab and glance at.
The Raspberry Pi Monitoring Architecture
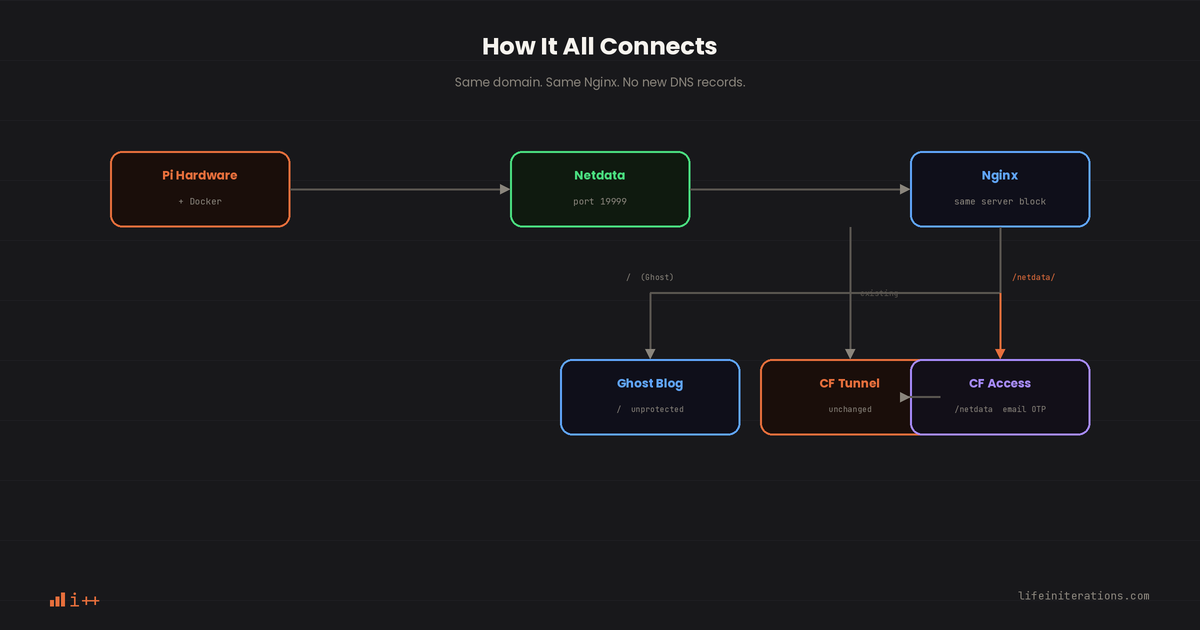
Here is the full architecture before we start:
Pi hardware + Docker containers
          |
       Netdata (Docker service, port 19999)
          |
       Nginx (same instance serving Ghost)
          |
   Cloudflare Tunnel (existing)
          |
   Cloudflare Access (email OTP gate)
          |
       Your browser
Netdata runs as a new service in our existing docker-compose.yml. Nginx gets a second server block for monitor.yourdomain.com, proxying to the Netdata container on the internal Docker network. Cloudflare Tunnel routes that subdomain to Nginx (same as it does for the blog). Cloudflare Access then sits in front of the whole thing and refuses to let anyone through unless they log in with the right email address.
Check out Self Hosting Personal blog on Pi for existing Ghost blog setup and it remains untouched. You are just extending it.
Step 1: Netdata Docker Compose Configuration
Open your docker-compose.yml. Add the following service alongside your existing Ghost and MySQL definitions:
services:
  # ... existing ghost and mysql services ...

  netdata:
    image: netdata/netdata:latest
    container_name: netdata
    pid: host
    networks:
      - blog_net
    ports:
      - "127.0.0.1:19999:19999"
    cap_add:
      - SYS_PTRACE
      - SYS_ADMIN
    security_opt:
      - apparmor:unconfined
    volumes:
      - netdataconfig:/etc/netdata
      - netdatalib:/var/lib/netdata
      - netdatacache:/var/cache/netdata
      - /etc/passwd:/host/etc/passwd:ro
      - /etc/group:/host/etc/group:ro
      - /proc:/host/proc:ro
      - /sys:/host/sys:ro
      - /etc/os-release:/host/etc/os-release:ro
      - /var/run/docker.sock:/var/run/docker.sock:ro
    restart: unless-stopped

volumes:
  # ... your existing volumes ...
  netdataconfig:
  netdatalib:
  netdatacache:
Let me explain the parts that are not obvious.
pid: host shares the host's process namespace with the Netdata container. Without this, Netdata can only see its own processes. With it, Netdata can see everything running on the Pi, which is what you actually want.
SYS_PTRACE and SYS_ADMIN are Linux capabilities Netdata needs to read low-level kernel metrics. These let it count network packets, read disk statistics, and access memory maps of running processes. It cannot do most of its job without them.
/proc:/host/proc:ro and /sys:/host/sys:ro mount the kernel's virtual filesystems into the container. The Netdata Docker image is designed to look for host metrics at the /host prefix by convention when running in Docker mode.
/var/run/docker.sock is how Netdata auto-discovers your other containers. Give it the socket and it will automatically start tracking Ghost, MySQL, and any other service in your Docker Compose stack by name. No manual configuration.
apparmor:unconfined disables AppArmor confinement for this container. On Raspberry Pi OS (Debian-based) AppArmor is usually inactive, so this line does nothing harmful. It is there to prevent a confusing startup failure on systems where it is active.
127.0.0.1:19999:19999 binds the port to localhost only. Netdata is not directly reachable from the internet; Nginx will handle that. Binding to loopback keeps the port off your external interface.
Once you have updated the file, start Netdata without touching the other containers:
docker compose up -d netdata
Watch the logs to confirm a clean start:
docker compose logs netdata --tail=30
Look for a line saying something like NETDATA: INFO: RRD files initialized. That is the ready signal. You can also verify the port is responding from the Pi itself:
curl -s http://localhost:19999 | head -5
If you get back HTML, Netdata is running.
Step 2: Add a server block in Nginx
Your Nginx config probably has one server block handling Ghost traffic. You are going to add a second one for the monitoring subdomain.
Create a new config file (or append to your existing config if you manage a single file):
/etc/nginx/conf.d/monitor.conf (or the equivalent path in your Nginx volume):
server {
    <Existing configuration>

    location = /netdata {
      return 301 /netdata/;
    }

    # Netdata under /netdata/
    location /netdata/ {
      # Netdata runs on host port 19999 (inside host network)
      proxy_pass http://netdata:19999/;

      proxy_http_version 1.1;
      proxy_set_header Host $host;
      proxy_set_header X-Forwarded-For $proxy_add_x_forwarded_for;
      proxy_set_header X-Forwarded-Proto $scheme;

      # Websocket support (Netdata uses it)
      proxy_set_header Upgrade $http_upgrade;
      proxy_set_header Connection "upgrade";
    }
}
The proxy_pass http://netdata:19999 line works because Nginx and Netdata are on the same Docker network (blog_net). Docker's internal DNS resolves the container name netdata to its private IP automatically. You do not need to hardcode anything.
The Upgrade and Connection headers are not optional. Netdata's dashboard streams live data over WebSockets. If you skip those two headers, the charts will load but never update. You will sit there wondering why your CPU graph is stuck at 0%.
Test the config before reloading:
docker compose exec nginx nginx -t
If that comes back clean:
docker compose exec nginx nginx -s reload
Step 3: Lock down /netdata with Cloudflare Access
Because the monitoring path sits on the same domain as the blog, Cloudflare Access needs to protect a path rather than an entire application.
Netdata shows you process names, container names, memory maps, network traffic patterns, and system call rates. You do not want that publicly readable.
Open Cloudflare Zero Trust
From your Cloudflare account dashboard, click "Zero Trust" in the left sidebar.
Create the application
- Go to Access > Applications
- Click "Add an application"
- Choose "Self-hosted"
- Give it a name. I used "Pi Monitor"
- Set the application domain to
<domain>.com - Set the path to
/netdata - Leave session duration at the default (24 hours works fine for personal use)
- Click Next
The path field is what focuses the protection on just the monitoring dashboard. The Ghost blog at / stays completely unaffected.
Create the access policy
- Name the policy. I called mine "Owner only"
- Set the action to "Allow"
- Under "Include", select "Emails" from the selector dropdown
- Type in your email address exactly
- Click Save policy
Enable One-time PIN authentication
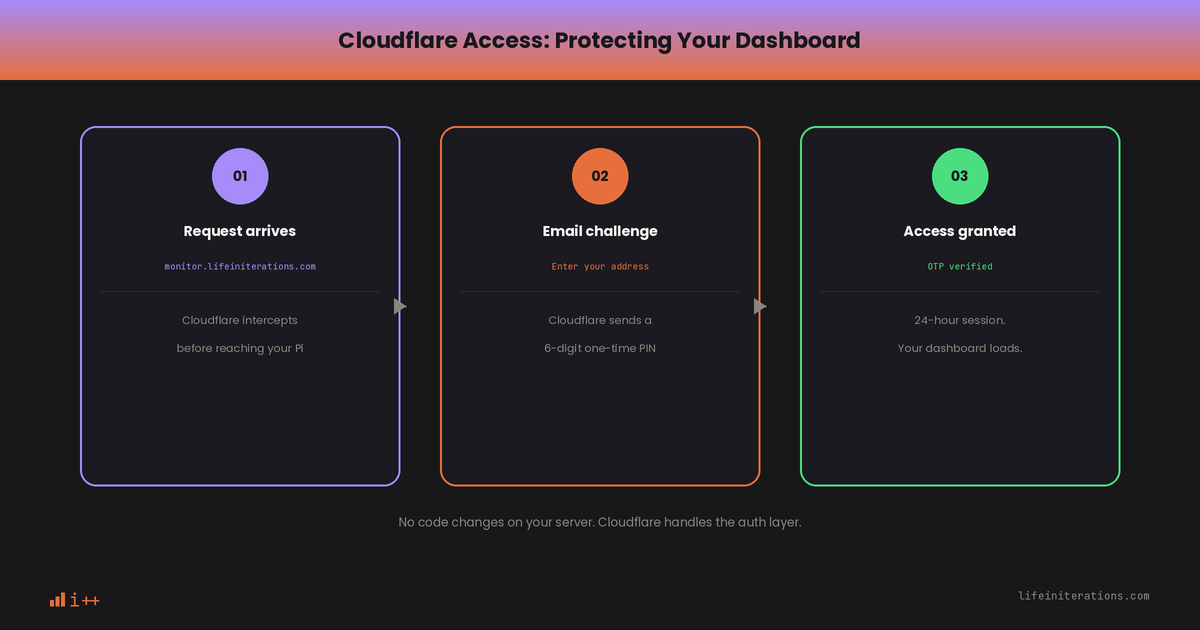
Cloudflare Access supports many identity providers. For a personal homelab with one authorized user, One-time PIN is the right choice. You enter your email on the challenge screen, Cloudflare sends a six-digit PIN to that address, you enter the PIN, and you are in for 24 hours.
- In the Authentication tab of your application, confirm "One-time PIN" is listed as an identity provider
- If it is not: go to Settings > Authentication in the sidebar, add it, then come back
If you already set up Cloudflare Access for /ghost, this is exactly the same flow. The application you created for Ghost still handles that path. This new application handles /netdata independently.
Test it
Open a private browser window and navigate to https://<domain>.com/netdata/. You should see a Cloudflare login screen asking for your email. Enter the authorized address, check your inbox, enter the PIN, and you will land on the Netdata dashboard.
What Netdata Monitoring Shows You on a Raspberry Pi
Here is a quick tour of the useful bits in the Netdata dashboard.
System overview is the first panel you see. CPU, RAM, swap, disk I/O, and network traffic all on one screen, updated every second. This is where you will spend most of your time.
Per-container metrics appear automatically in a "Docker" or "cgroups" section. You can see exactly how much CPU and RAM Ghost and MySQL are each consuming. If MySQL starts eating memory after a query, you will see it here.
CPU temperature matters on a Pi. Thermal throttling starts at 80C and the processor will slow itself down to protect the hardware. Netdata shows the SoC temperature alongside CPU utilization so you can see when the two are correlated.
Network interface stats show traffic in and out by interface. If bots start crawling your blog, you will see a bandwidth spike. You can correlate it with CPU load to understand the impact.
Disk I/O is the metric most likely to change over time on a Pi. MicroSD cards degrade. Read and write latency will increase as the card wears. Netdata makes that trend visible before it becomes a problem.
Built-in alerts come pre-configured. Netdata ships with health checks for high CPU, low free RAM, disk-full conditions, and other common issues. When one fires, you will see a red indicator on the dashboard and a notification in the alerts panel. No additional setup required.
If you are also self-hosting on a Pi, you should have this running before your first traffic spike. You want to understand what normal looks like before you need to diagnose what abnormal looks like.
Netdata vs Prometheus and Grafana
People often ask how Netdata compares to running Prometheus with Grafana, so here is the honest version. Netdata is zero-configuration, samples every second, runs as a single container, and is ideal for a single box. Prometheus paired with Grafana is pull-based, scales across hosts, and retains history far longer, at the cost of substantially more setup.
On a Pi running a handful of containers, Netdata wins on effort-to-value. Prometheus wins once you are monitoring several machines or need long retention.
Raspberry Pi Monitoring FAQ
What is the best way to monitor a Raspberry Pi server?
Netdata is the easiest path if you want real-time, zero-configuration monitoring. It runs as a single Docker container, auto-discovers your other containers, and gives you a live dashboard covering CPU, RAM, disk, network, and temperature within minutes of starting it. For a homelab running Ghost or similar self-hosted services, it is the fastest way to go from blind to fully visible.
Does running Netdata on a Raspberry Pi add much overhead?
It is light enough to run alongside other services on a Pi. Netdata is written in C and designed to sample metrics efficiently, so on a Pi already running Ghost and MySQL in Docker, the added CPU and RAM footprint is small relative to what those other services already use.
How do I secure a Netdata dashboard exposed to the internet?
Do not expose Netdata's port directly. Bind it to localhost, put it behind an Nginx reverse proxy, and gate that proxy path with something like Cloudflare Access so only your email can authenticate. Netdata shows process names, container details, and traffic patterns, all of which you want kept private rather than publicly reachable.
Can Netdata monitor Docker containers automatically?
Yes. Mounting the Docker socket into the Netdata container lets it auto-discover every other container in your Compose stack and report per-container CPU, RAM, and network usage without any manual setup. This is how Netdata tracks Ghost and MySQL usage separately in this setup.
How do I check Raspberry Pi CPU temperature remotely?
Once Netdata is running, the SoC temperature shows up automatically on the main dashboard alongside CPU utilization. That is useful on a Pi specifically because thermal throttling kicks in around 80C, and seeing temperature next to load lets you tell whether a slowdown is thermal or just genuine demand.
Can I run Netdata with Docker Compose?
Yes. Netdata runs as a single service in your existing docker-compose.yml, alongside your Ghost and MySQL containers. You give it host PID access, the SYS_PTRACE and SYS_ADMIN capabilities, and mount the Docker socket plus the host's /proc and /sys, then bring it up with docker compose up -d netdata. It starts on port 19999 with per-second metrics and auto-discovers your other containers, so there is no separate installation step.
What's the difference between Netdata and Prometheus?
Netdata is zero-configuration, samples every second, runs as a single container, and is ideal for a single box. Prometheus paired with Grafana is pull-based, scales across many hosts, and retains history far longer, at the cost of substantially more setup. On a Raspberry Pi running a handful of containers, Netdata wins on effort-to-value; Prometheus wins once you are monitoring several machines or need long-term retention.