Configuring Alerts on pi Server
Watching a dashboard is not monitoring. Real monitoring is when your server emails you the moment something goes wrong. Here is how I wired Netdata to Mailgun to make that happen.

There is a difference between having a monitoring dashboard and actually being monitored.
I had the dashboard. I set up Netdata, got it running at lifeiniterations.com/netdata, and it was genuinely satisfying to watch those real-time charts. CPU, memory, disk I/O, Docker container stats, all of it live and updating every second.
But I still found out about problems from browser timeouts.
By the end of this post, you will have Netdata sending you an email through Mailgun the instant CPU utilization holds above 80% for five continuous minutes. No local mail server required, no extra containers to run, just a config file and a Mailgun API key.
If you do not have Netdata running yet, get that sorted first: Setting Up Netdata Monitoring on a Raspberry Pi. This post picks up from there.
How Netdata's Alert System Works
Before opening any config file, it helps to see the two-layer system Netdata uses for alerts.
Layer 1: Alarm definitions. These live as .conf files inside /etc/netdata/health.d/. Each file describes what to watch, what value crosses a threshold, and what role receives the notification. Netdata ships with defaults for CPU, memory, disk, and network, but you can write your own or override the built-ins.
Layer 2: Notifications. When an alarm state changes — from OK to WARNING, or WARNING to CRITICAL — Netdata calls /usr/libexec/netdata/plugins.d/alarm-notify.sh. That script reads /etc/netdata/health_alarm_notify.conf and knows how to deliver alerts to email, Slack, PagerDuty, and more. You can also define a custom sender directly in that config file, which is exactly what we will do for Mailgun.
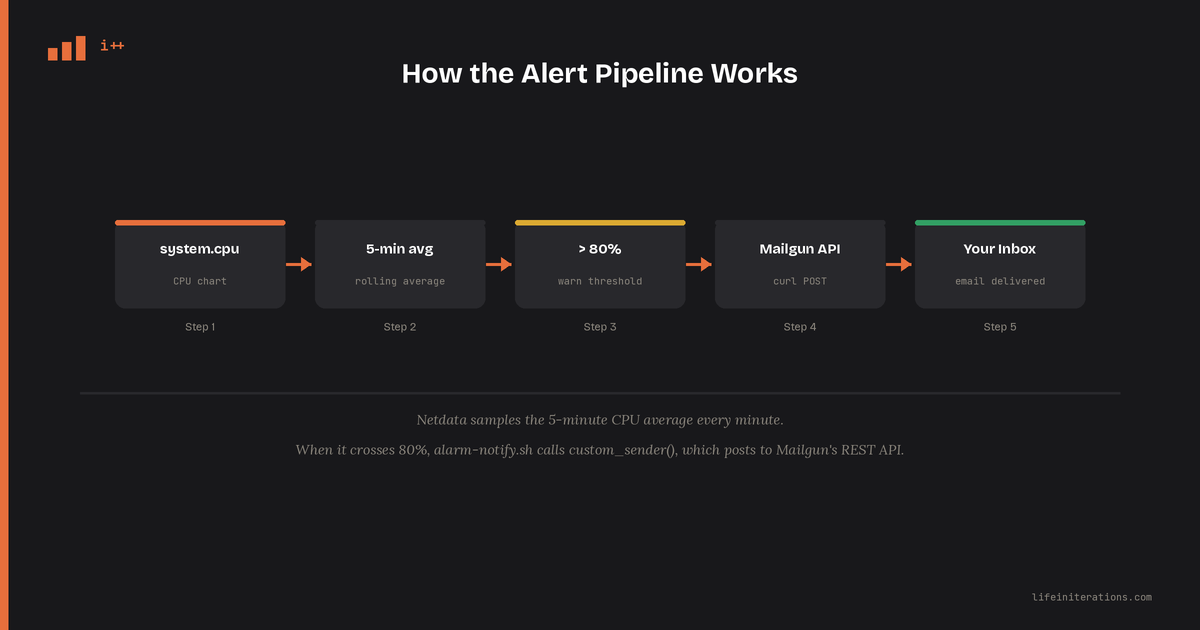
Two files. One defines the rule. The other delivers it.
Step 1: Find Your Config Directory
If you followed the Netdata setup post, Netdata is running in Docker with its config directory mounted as a volume. That means you can edit config files directly on the host without exec'ing into the container.
To confirm where the config is mounted:
docker inspect netdata | grep -A 5 '"Mounts"'
Look for the mount that maps to /etc/netdata inside the container. The Source field is the path on your host machine. That is where you will create files.
If you used a named volume rather than a bind mount, the files live inside Docker's managed storage. You can still edit them by opening a shell inside the container:
docker exec -it netdata bash
Throughout this post I will write paths as /etc/netdata. If you have a bind mount, substitute your actual host path.
Step 2: Write the CPU Alert
Create a new file at /etc/netdata/health.d/cpu_alert.conf:
alarm: high_cpu_usage
    on: system.cpu
lookup: average -5m unaligned except idle
 units: %
 every: 1m
  warn: $this > 80
  crit: $this > 90
 delay: down 15m multiplier 1.5 max 2h
  info: average CPU utilization over the last 5 minutes exceeded threshold
    to: sysadmin
Here is what each field does:
alarm: high_cpu_usage is the unique name for this alarm. Netdata uses it in notifications and for deduplication.
on: system.cpu tells Netdata which chart to watch. system.cpu is the main CPU breakdown chart, populated from /proc/stat.
lookup: average -5m unaligned except idle is the measurement. It computes the average of all CPU dimensions except idle over the last five minutes. Because system.cpu dimensions are in percentage terms and sum to 100%, excluding idle gives you total CPU utilization.
units: % adds the percent sign to the value in notifications, so you see 85.3 % instead of just 85.3.
every: 1m runs the check once per minute.
warn: $this > 80 fires a WARNING when the five-minute average exceeds 80%.
crit: $this > 90 escalates to CRITICAL above 90%. You get a second notification if things get worse.
delay: down 15m prevents the recovery email from firing until CPU has been back below the threshold for 15 full minutes. Without this, a CPU bouncing around 80% would spam you with cleared and re-triggered notifications every few minutes.
to: sysadmin routes this alarm to the sysadmin notification role. You will connect that role to Mailgun in step 4.
One thing to check: Netdata ships with its own CPU alarm file at /etc/netdata/health.d/cpu.conf. If that file exists in your mounted config directory, you may already have a default CPU alarm active. The two will run independently and both will trigger. You can leave it, or comment out the default alarm in that file if you want a single clean alert.
Step 3: Get Your Mailgun Credentials
You need two things: a Mailgun API key and a sending domain.
If you do not have a Mailgun account, the free tier covers this. It includes 1,000 emails per month and a sandbox domain available immediately.
- Log into mailgun.com and go to Sending > Domains. You will see a sandbox domain that looks like
sandbox-xxxxxxxxxxxxxxxxxxxxxxxxxxxxxxxx.mailgun.org. Copy it. - Go to API Security from the account dropdown in the top-right corner. Copy an existing API key or create a new one. It starts with
key-.
One gotcha with the sandbox domain: Mailgun restricts it to sending only to email addresses you have manually verified. Go to Sending > Overview > Authorized Recipients and add your email address there before you test.
If you have a custom domain already configured in Mailgun (like mg.yourdomain.com), use that instead. No recipient restrictions apply.
Step 4: Configure the Mailgun Notification
Open /etc/netdata/health_alarm_notify.conf. If it does not exist at your host path yet, pull the template from inside the container first:
docker exec netdata cat /etc/netdata/health_alarm_notify.conf \
  > /your/host/config/path/health_alarm_notify.conf
Add the following block. You can place it at the top of the file or append it at the bottom:
# Disable default email (no local MTA available in Docker)
SEND_EMAIL="NO"

# Enable custom notification via Mailgun API
SEND_CUSTOM="YES"
DEFAULT_RECIPIENT_CUSTOM="sysadmin"

custom_sender() {
    local MAILGUN_API_KEY="key-your-api-key-here"
    local MAILGUN_DOMAIN="sandbox-xxxx.mailgun.org"
    local TO_EMAIL="[email protected]"
    local FROM="Netdata Alerts <netdata@${MAILGUN_DOMAIN}>"

    local subject="[${status}] ${host}: ${alarm}"
    local body
    body="$(cat <<MSG
Netdata Alert

Alarm  : ${alarm}
Status : ${status}
Value  : ${value_string}
Chart  : ${chart}
Host   : ${host}
Info   : ${info}

Sent by Netdata on ${host}.
MSG
)"

    local http_code
    http_code=$(curl -s -o /dev/null -w "%{http_code}" \
        --user "api:${MAILGUN_API_KEY}" \
        "https://api.mailgun.net/v3/${MAILGUN_DOMAIN}/messages" \
        -F from="${FROM}" \
        -F to="${TO_EMAIL}" \
        -F subject="${subject}" \
        -F text="${body}")

    if [ "${http_code}" = "200" ]; then
        return 0
    fi

    echo "Mailgun returned HTTP ${http_code}" >&2
    return 1
}
Replace key-your-api-key-here, sandbox-xxxx.mailgun.org, and [email protected] with your actual values.
A few things worth understanding about this config:
SEND_EMAIL="NO" disables Netdata's built-in email sender. Without a local mail transfer agent inside the Docker container, that sender would fail silently anyway. Disabling it explicitly keeps the logs clean.
custom_sender() is a bash function that alarm-notify.sh sources from this config file and calls when a custom notification needs to go out. Netdata populates the variables ${status}, ${host}, ${alarm}, ${value_string}, ${chart}, and ${info} before calling your function. You decide what to do with them.
The curl call posts to Mailgun's REST API using HTTP basic auth with your API key as the password. The -w "%{http_code}" flag captures the response status code so you can log failures.
The netdata/netdata Docker image includes curl by default, so no extra packages are needed.
Step 5: Reload and Test
Reload Netdata's health system without restarting the container:
docker exec netdata netdatacli reload-health
If that command is not available on your Netdata version, a container restart also works:
docker restart netdata
Now send a test notification. Netdata's alarm-notify script has a built-in test mode that fires a fake WARNING and CRITICAL alert through every enabled sender for a given role:
docker exec netdata \
  /usr/libexec/netdata/plugins.d/alarm-notify.sh test sysadmin
Check your inbox. The test email should arrive within about 30 seconds.
If nothing arrives, check two places:
# Netdata's notification log
docker exec netdata cat /var/log/netdata/alarm-notify.log

# Mailgun's send log — Dashboard > Sending > Logs
Netdata will log any non-zero return from custom_sender(), including the HTTP code that curl returned. Mailgun's log will show whether the message was accepted by the API and what happened to it during delivery.
What a Real Alert Looks Like
When CPU genuinely holds above 80% for five minutes, the subject line will read something like:
[WARNING] <yourdomain>: high_cpu_usage
The body contains the alarm name, current status, the measured five-minute average, which chart triggered it, and the info string you wrote. Not a beautifully designed template, but exactly the information you need to start diagnosing immediately.
If the situation escalates beyond 90%, a second email arrives with [CRITICAL] in the subject. When CPU drops back and stays below the threshold for 15 minutes, you get a [CLEAR] email to close the loop.
My server has been talking to me for a couple of weeks now. The first real alert I got was a WARNING at 11pm on a Thursday because a backup script was saturating the CPU during a large mysqldump. I knew within a minute of it starting. That is a very different experience from finding out the next morning when someone sends a "your site is slow" message.
The dashboard was always there. The alerts are what made it worth something.