MCPs(Model Context Protocol): Peripherals for the AI
I used to think of AI as one big brain typing back at me. Then I plugged in an MCP(model context protocol) server and understood, these are peripherals, and they change everything.

For the longest time I thought of AI as one big brain in a box. You type something in, it thinks, it types something back. That felt like the whole interaction.
Then I plugged an MCP server into Claude and watched it read a Slack channel, open a page in Notion, and take a screenshot of my own website, all without me touching a single button in between. My mental model snapped into place right there. MCP servers are not more brain. They are peripherals.
This blog is about what MCP is and how it can be useful. I will also cover how I setup daily audit of this blog site using MCPs of google analytics and google search console in the next site.
What Is MCP, Actually?
MCP stands for Model Context Protocol. It's an open standard that lets an AI model talk to outside tools and data sources through one common interface, instead of every integration being its own custom wiring job.
Think about USB for a second. Before USB, every device needed its own port and its own driver. A mouse used one connector, a printer used another, and getting them to work together was a small nightmare. USB fixed that by giving every peripheral the same plug and the same rules for talking to the computer.
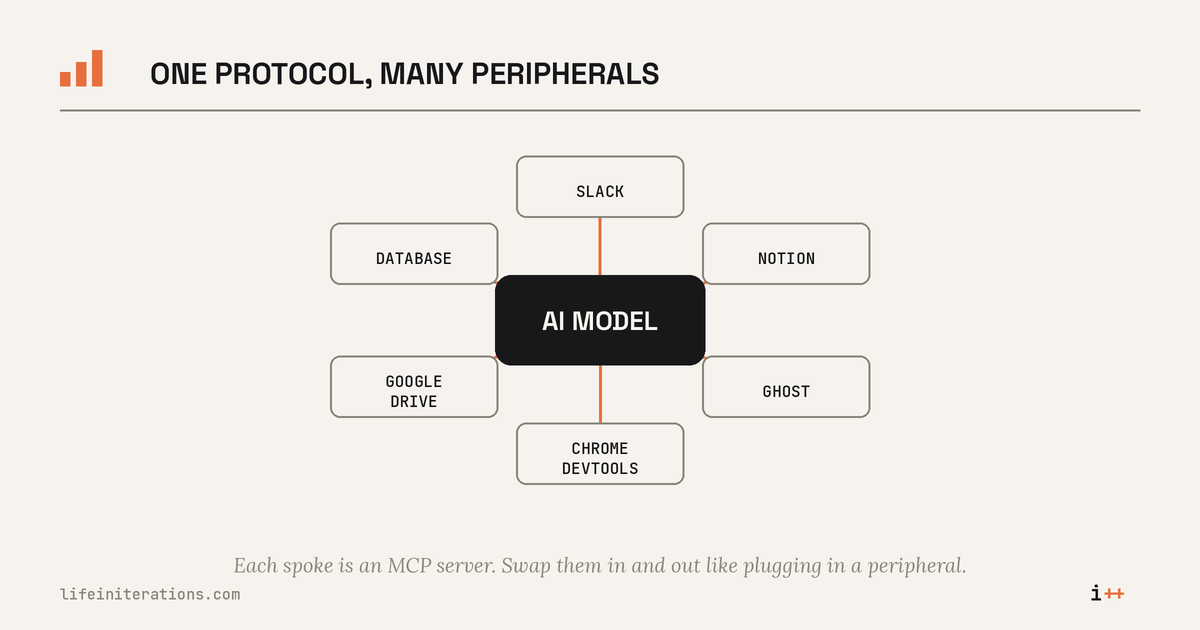
MCP does the same thing for AI models. An MCP server is the peripheral. It could be a connector to Slack, to Notion, to a database, or to a live Chrome browser. An MCP client, like Claude Desktop or Claude Code, is the computer with the USB port. Plug a server in, and the model suddenly has a new sense or a new set of hands, without anyone needing to rebuild the model itself.
Why MCPs Are Genuinely Useful
This is the part that took me a minute to appreciate. A model on its own is limited to what it already knows and what you paste into the chat window. That's a closed loop. MCPs break the loop open.
Here's what changes once you plug a few in:
- The AI gets hands. It can create a Notion page, send a Slack message, or draft this exact blog post directly in Ghost instead of you copying markdown back and forth.
- The AI gets eyes. It can look at a live webpage, a real spreadsheet, or your actual analytics dashboard instead of guessing based on a description you typed.
- The AI gets memory of your world. Instead of generic advice, it can pull from your specific Notion workspace, your specific Slack history, your specific blog.
- You get composability. MCP servers stack. I run a Ghost MCP server for publishing, a Notion server for planning, and a Chrome DevTools server for debugging, all in the same conversation, swapped in and out like peripherals on a desk.
| Without MCP | With MCP |
|---|---|
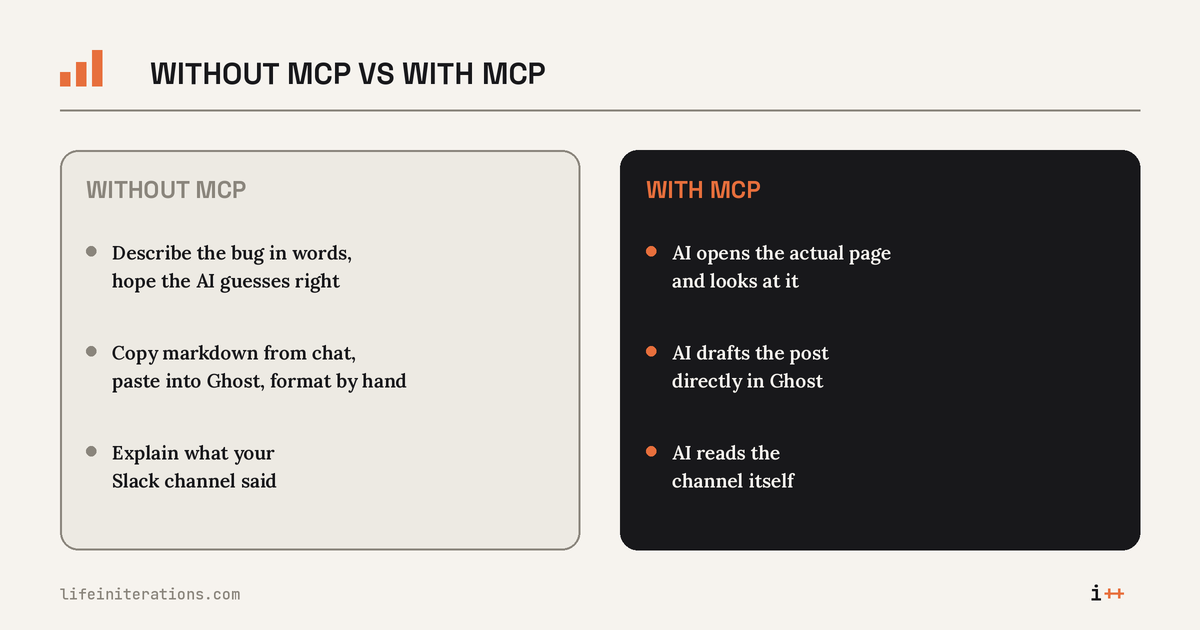
| Describe the bug in words, hope the AI guesses right | AI opens the actual page and looks at it |
| Copy markdown from chat, paste into Ghost, format manually | AI drafts the post directly in Ghost |
| Explain what your Slack channel said | AI reads the channel itself |
The theme across all of it is the same. MCP turns an AI from something you talk to into something you can actually hand a task to.
Meet Chrome DevTools MCP
The one I want to walk through today is chrome-devtools-mcp, an official MCP server from the Chrome DevTools team. It's built on Puppeteer under the hood, and it gives your AI assistant real control over a live Chrome browser instead of a text description of one.
It exposes tools across six categories:
- Navigation, opening pages, switching tabs, going back and forward
- Input automation, clicking, typing, filling forms
- Debugging, reading console messages and stack traces
- Network, inspecting requests and responses
- Performance, recording traces and surfacing bottlenecks
- Emulation, testing different viewports and conditions
For someone running a self-managed blog, this is exactly the kind of peripheral that earns its keep. Instead of explaining a layout bug in words, you point the AI at the actual URL and let it see what you're seeing.
Setting It Up
Here's the version I actually got working, no fluff.
What you need first:
- Chrome 144 or newer (you're almost certainly already there)
- Node.js installed, so
npxworks from your terminal - Claude Desktop, Claude Code, or any other MCP capable client
Step 1: Add the server to your config
For Claude Desktop, open your config file and add this entry:
{
  "mcpServers": {
    "chrome-devtools": {
      "command": "npx",
      "args": ["-y", "chrome-devtools-mcp@latest"]
    }
  }
}
For Claude Code, it's a one liner in your terminal:
claude mcp add chrome-devtools npx chrome-devtools-mcp@latestStep 2: Point it at your real browser
By default, this spins up a fresh, empty Chrome instance. That's not what you want when you're debugging something on a live site, since you'll lose your tabs and any logged in sessions. Add the --autoConnect flag so it grabs your actual running browser instead:
{
  "mcpServers": {
    "chrome-devtools": {
      "command": "npx",
      "args": ["chrome-devtools-mcp@latest", "--autoConnect"]
    }
  }
}
Then in Chrome, go to chrome://inspect/#remote-debugging and enable remote debugging when it asks for confirmation.
Step 3: Restart and verify
Fully restart your client, not just a reload. Then give it a simple test prompt like "check the performance of lifeiniterations.com." If it opens a browser window and comes back with real numbers instead of a guess, you're wired up correctly.
Debugging a Real Prod Bug With It
Here's a bug that actually happens on this exact stack. Ghost strips class based CSS out of HTML cards, so a checklist card that looked perfect in local preview can lose its border and spacing the moment it goes live, because the class names it depended on got stripped and only inline styles survive.
With Chrome DevTools MCP connected, the debugging conversation looks like this:
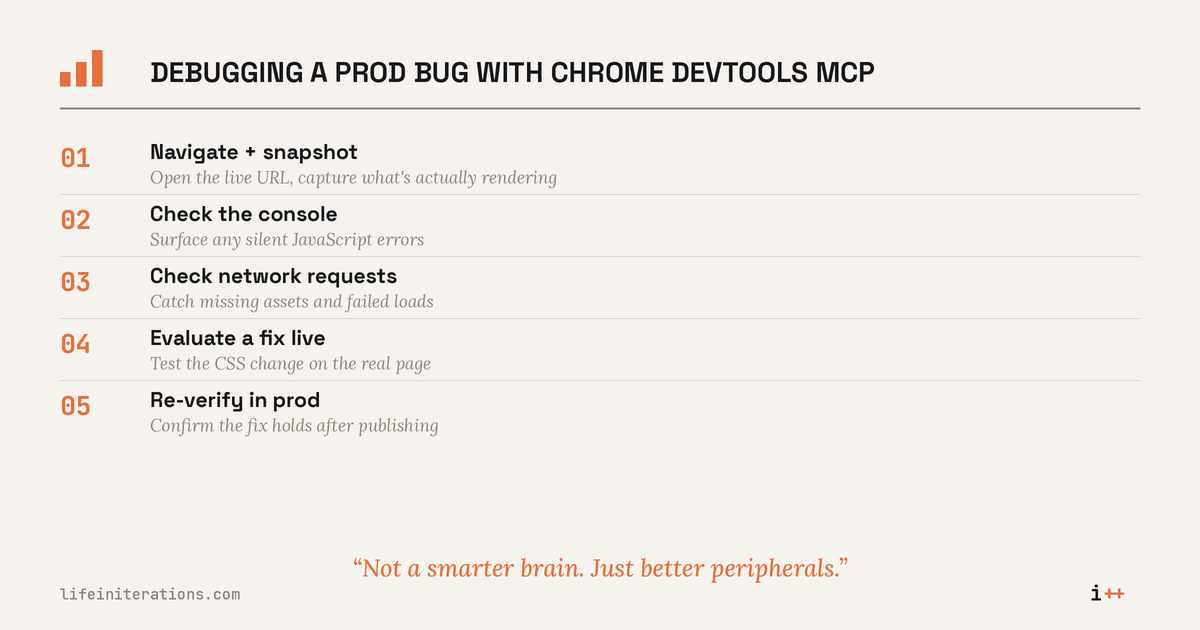
- "Navigate to the live post and take a snapshot." The AI opens the real URL and captures what's actually rendering, not what the markdown source says should render.
- "Check the console for errors." This surfaces any JavaScript failures that might be silently breaking layout.
- "Check the network requests for that page." This catches missing assets, like a font or image returning a 404 in production that worked fine locally.
- "Evaluate this CSS change and tell me if the card fixes itself." You can test a fix live, in the actual page, before touching the Ghost editor.
- Re-navigate after the real fix is in to confirm it holds up in production, not just in theory.
The difference between this and the old way of debugging is worth sitting with. Before, I'd stare at a screenshot, guess what broke, patch something, republish, and refresh to see if it worked. Now the AI is looking at the same DOM I am, in real time, on the real URL.
Where I'm Taking This Next
Chrome DevTools MCP is the one I reached for first because debugging a live layout bug is such an obvious, visible win. But it's really just one peripheral on the desk.
If you've been following the local LLM series on this blog, this is the same idea from a different angle. Give the AI more of the right inputs and outputs, and it stops being a chatbot and starts being a tool you actually work alongside.
Peripherals are only half the story, though. An MCP server changes what Claude can touch; a skill file changes how it behaves once it's holding the tool. I run both side by side, one gives Claude hands and eyes, the other gives it standing instructions for how to use them.
That's MCP in a nutshell. Not a smarter brain. Just better peripherals.